Communities are a powerful tool to describe the structure of complex networks. Algorithms aiming at maximizing a quality function called modularity have been shown to effectively compute the community structure.
However, some problems remain:
It is possible to find high modularity partitions in graph without any community structure, in particular random graphs.
In this article i will state the notion of consensual communities and show that they do not exist in random graphs.
For that, we exhibit a phase transition based on the strength of consensus:
below a given threshold, all the nodes belongs to the same consensual community
above this threshold, each node is in its own consensual community.
In random graphs, however, links appear independently of each other, so a strong inhomogeneity in the density of links on these graphs is not expected. Therefore, random graphs should not have communities using the previous definition.
It is however possible to find partitions with significantly high modularity in random networks.
A good community detection algorithm should therefore be able to find communities but also to indicate their absence.
Author of the paper (The Power of Consensus: Random Graphs Have No Communities) has proved that random graphs only contain trivial consensual community, i.e. containing all the nodes of the graph or only a single node. and also showed there is a phase transition between these two states depending on a resolution parameter.
In random graphs, all pairs of nodes have the same probability to be connected. Hence, they should not have preferential binding inducing specific and identifiable nodes groups.
Therefore, we could conclude that there are no community structure in random graphs.
However, several studies show that it is possible to find partitions with high modularity in random graphs [ref1], [ref2]
Indeed, the links concentration fluctuates in generated graphs, which means that subsets of nodes with a density larger than global density can appear.
The phenomenon is even more pronounced in regular or quasi-regular graphs, like trees, torus or grid graphs, in which community detection algorithms can also find partitions with good modularity


To compare more precisely real and random networks, they generated random graphs from the Erdos-Renyi model that have the same size and the same average degree (resp. the same degree distribution) as two realworld networks.

In Fig 2., the Erdos-Renyi model shows no pair of nodes with pij = 0, which means that all pairs of nodes have been grouped together at least once during 1,000 runs of the Louvain algorithm, regardless of their position in the network.

then , we will apply cluster_walktrap function for detecting Community strucure via short random walks in r on the graph. and observe the community patterns generated and No. of steps(iteration) of algorithm.(R code is as below :)
However, some problems remain:
It is possible to find high modularity partitions in graph without any community structure, in particular random graphs.
In this article i will state the notion of consensual communities and show that they do not exist in random graphs.
For that, we exhibit a phase transition based on the strength of consensus:
below a given threshold, all the nodes belongs to the same consensual community
above this threshold, each node is in its own consensual community.
In random graphs, however, links appear independently of each other, so a strong inhomogeneity in the density of links on these graphs is not expected. Therefore, random graphs should not have communities using the previous definition.
It is however possible to find partitions with significantly high modularity in random networks.
A good community detection algorithm should therefore be able to find communities but also to indicate their absence.
Author of the paper (The Power of Consensus: Random Graphs Have No Communities) has proved that random graphs only contain trivial consensual community, i.e. containing all the nodes of the graph or only a single node. and also showed there is a phase transition between these two states depending on a resolution parameter.
In random graphs, all pairs of nodes have the same probability to be connected. Hence, they should not have preferential binding inducing specific and identifiable nodes groups.
Therefore, we could conclude that there are no community structure in random graphs.
However, several studies show that it is possible to find partitions with high modularity in random graphs [ref1], [ref2]
Indeed, the links concentration fluctuates in generated graphs, which means that subsets of nodes with a density larger than global density can appear.
The phenomenon is even more pronounced in regular or quasi-regular graphs, like trees, torus or grid graphs, in which community detection algorithms can also find partitions with good modularity
A good algorithm for community detection should indicate that communities obtained in random graphs are not real communities. We will now show that random graphs do not exhibit any non-trivial ccs. For this,
we will use random graphs model: the classical Erdos-Renyi model

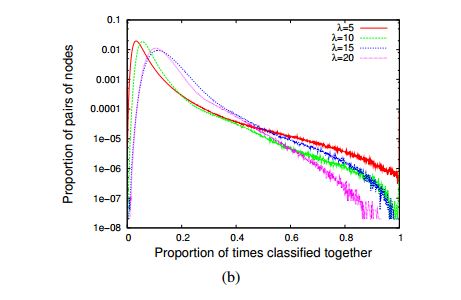
Above figures shows Distribution of the pij(he probability for drawing an edge between two arbitrary vertices ) averaged over 100 random Erdos-Renyi graphs.
(a) Networks with different number of nodes n and an average degree of λ = 20.
(b) Networks with n = 1,000 nodes and different values of the average degree.
This concentration of values implies that even if partitions with a good modularity can be found in random graphs, these partitions are very different from one another since most pairs are classified in the same community only once every ten runs
"Comparison with Real Graphs"
To compare more precisely real and random networks, they generated random graphs from the Erdos-Renyi model that have the same size and the same average degree (resp. the same degree distribution) as two realworld networks.

Fig 2: pij distribution for two real-world networks together with Erdos- ˝
Renyi ´ and configuration model random graphs with the same size: the email
network (top) and the collaboration network (bottom)
In Fig 2., the Erdos-Renyi model shows no pair of nodes with pij = 0, which means that all pairs of nodes have been grouped together at least once during 1,000 runs of the Louvain algorithm, regardless of their position in the network.
Conversely, there is nearly no pair of nodes which are always grouped together, except for the leaves (nodes of degree 1) of the network which are always grouped with their only neighbor. This presence of nodes of degree 1 is very common
There is two direct consequences of this distribution:
(i) for very low values of the threshold, there is a single CC containing all nodes since there is no value close to zero and therefore the virtual graph contains all links, and
(ii) for large values of the threshold, the virtual graph contains almost no links and therefore high threshold CCs are reduced to single nodes.

Fig 3. Proportion of internal links for a random graph with 10,000 nodes
Finally, we can compute the value of this threshold.
Let us assume that k% of links are intra-community links. Then, this means that for each execution of the algorithm, one node u will be put in expectation with k% of its neighbors, or equivalently each neighbor will be with the given node u for k% of the executions. This value k is thus the value of pij corresponding to the p that we have used so far. Computing exactly the value of p is an open problem that seems to be difficult [ref2]. However, numerical studies (see Fig. 3) show that it decreases with the graph density but that the exact decrease pattern is quite complex.
It would be interesting to analyze this phenomenon on others random graphs families such as Watts-Strogatz model,Barabasi-Albert model, etc.
On a more general perspective, the computational issue has to be addressed. Indeed, computing ccs on large graphs can be hard even with very fast underlying algorithms such as Louvain, and different techniques should be used, such as local computations for instance.
Also, to show the above behavior, i had simulated the following in R :
First, we will generate one random graph according to the Erdos-Renyi model
First, we will generate one random graph according to the Erdos-Renyi model
# Generate random graphs according to the Erdos-Renyi modelgraph <- erdos.renyi.game(50, 0.3, type=c("gnp", "gnm"), directed = FALSE, loops = FALSE)
then , we will apply cluster_walktrap function for detecting Community strucure via short random walks in r on the graph. and observe the community patterns generated and No. of steps(iteration) of algorithm.(R code is as below :)
## no of steps we are going to perform of algorithm cluster_walktrap
## cluster_walktrap is function for Community strucure via short random walks in r
allsteps <- 1:10
##stores all the membership vectors for membership of particular node of graph
membershipframe <- 1:50
##stores modularity values for each iteration.
m <- c()
for (i in allsteps ){
wtc <- cluster_walktrap(graph,steps = i) ##find community by "i" steps of "cluster_walktrap"
m<- c(m,modularity(wtc)) ##store modularity
membershipframe <- cbind(membershipframe,membership(wtc)) ##store membership
##save plots
plotname <- paste("rplot",i)
plotname <- paste(plotname,".jpg",collapse = "")
jpeg(plotname)
plot(wtc,graph)
dev.off()
}
all the plots are looking like :
Great and Thanks for the code!
ReplyDelete