Introduction
Meaningful insights can be drawn from a suitable network representation of social, biological and other real life dynamic systems. During the last two decades, the grown availability of computational resources have helped to explore the topological properties of these networks. These explorations reveals the fact that most of these networks have a common set of characteristics e.g. distribution of connectivities, degree distribution etc. In this article I have demonstrated such characteristics of a social network constructed under the influence of musical taste of users. When two songs co-occur in a playlist, a link between them is created in the network. These leads us to a dynamic complex network. This study was done on by Javier M Buldu, P Cano, M Koppenberger, Juan A Almendral and S Boccaletti [1] for the period of 1997-2005 on the data collected for the Art of the Mix project. (http://www.artofthemix.org/)
Since the playlists have an input date, we can visualize the evolution of the network over time. The authors have also gathered some information that can be useful for music recommendation and gives us some hints about the top hit charts.
The network of musical taste
The Art of the Mix is a project started in 1997 where users upload and interchange playlists of their favorite music. Whenever a playlist is added, the music track in the playlists are added to the network (if they don't exist in the network already) and the co-occurrence of two tracks in a same playlist gives rise to an edge between the tracks in the network. The weight of an edge in the number of playlists in which the co-occurrence has occurred. Figure 1 summarizes the above procedure. Once we have the network, we can easily check that the network has some fundamental features-
a. The network is undirected.
b. It is weighted.
c. The links are symmetric.
d. The network is a conglomeration of cliques.
a. The network is undirected.
b. It is weighted.
c. The links are symmetric.
d. The network is a conglomeration of cliques.
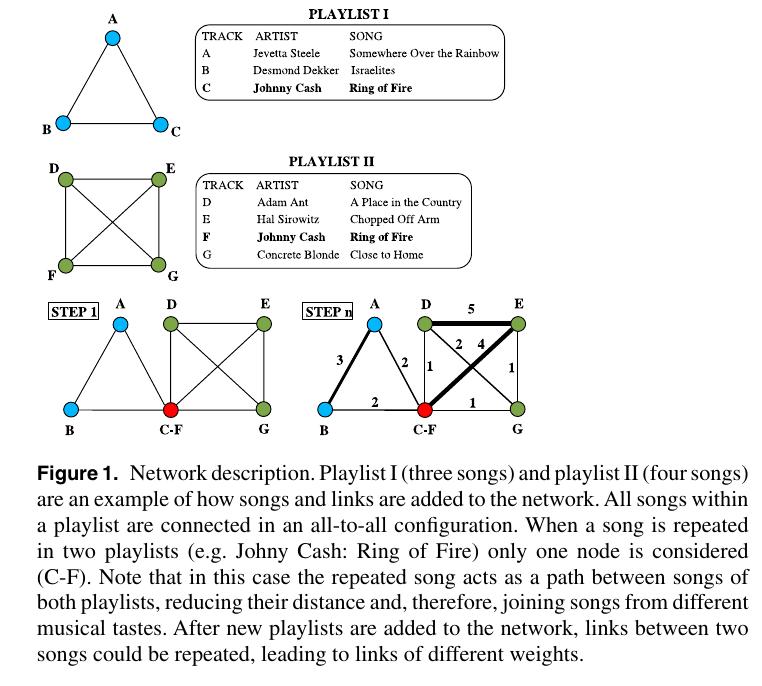
We must clarify that a playlist is designed under the influence of a certain musical taste, but it does not represent the musical taste itself. In this sense, two different playlists may have a high percentage of repeated songs and belong to different musical tastes. This is due to the fact that a single song can not be associated to a unique musical taste.
The evolution of network
The network has grown remarkably between 1997-2005 where more than 82,000 playlists were added in the collection with each playlists having an average of 22 songs. In the study the authors have demonstrated various statistical parameters to characterize the network. The evolution of network in terms of common network statistics e.g. number of nodes, number of edges, mean geodesic length, size of the giant connected component (GCC) and the average clustering coefficients have summarized for the period of 1997-2005 in the below table and figure 2.


It is interesting that the number of links per node also increased along with the number of nodes in the network. This indicates that the average number of songs in a playlist have increased during this time period up to a certain limit.
We can observe that the size of the GCC has increased drastically up to 92% which indicates that more than 92% of the nodes can be connected by a path. Similarly, the saturation of the average clustering coefficients indicates that the ratio of repeated songs remains constant despite the evolution of the network. It is also worth noting that the decrease in average clustering coefficient reveals the appearance of same songs in different playlists i.e. increase in the number of bridge points. This same kind of power law decay of C is also found in many real life networks. We can observe that in all cases the network shows "small-world phenomenon" i.e. despite the higher number of nodes, any two nodes can be connected by a path of length not more than 15. Moreover, the average distance between two nodes have decreased to 4, despite the total number of nodes being .5 million.
We can also measure the popularity of a song (strength of a song) using the statistic -
Where wij is the weight between the nodes i,j and N is the number of neighbors of node i.
In figure 3, the average strength S(k) of nodes with degree k have plotted for each year. The linear relation shows that the average remains constant i.e. the weight of a link is independent of the degree of the nodes. Which reflects that the popular songs are not necessarily repeated in a same playlist.

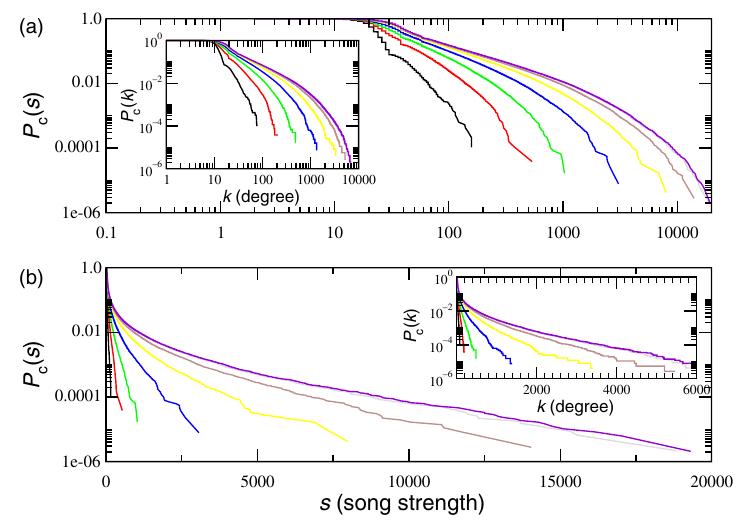
Another way of characterize networks is to analyze the distribution of the network degrees p(k), defined as the fraction of nodes that have a degree k. Most of real world networks shows power law decay in the cumulative degree distribution. Here, the authors have considered pc(k) and the cumulative strength distribution pc(s). Figure 4 shows the evolution of pc(s) and pc(k) (insets) in log–log (a) and linear–log (b) scales.
Similarly, the authors have also studied the evolution of average clustering coefficient C(k) of nodes with degree k. The power law decay is intuitive. The nodes with high degrees are the songs that are in many different playlists. Hence, the connectivity between its neighbors are less. Whereas, the small degree nodes are the songs that are added in fewer number of playlists. For example, if a song is just in a single playlist, then its C is 1.

Finally, to measure assortativity the authors have evaluated average degree of neighbors for each node.

where p(k'|k) is the fraction of links joining a node of degree k and k'. Though knn is an increasing function of k, it saturates after a certain stage. This indicates that despite the fact that same degree songs tend to co-occur, it is highly unlikely to find two very popular (degree) chart in the same playlist, as the size of the network increases.

Associations between tracks
In this section we are interested in measuring the probability of co-occurrence of two tracks within a same playlist. For a given node a in the network we measure the association of a with its neighbors. We define Association(a,b_i) as -

, where w_abi is the weight between nodes a and b_i and n_a, n_bi are the degrees of a and b_i in the whole network.
Using this metric, we can generate a symmetric affinity matrix of size N*N with zero diagonal.The ith row of the matrix indicates the association of ith song with other songs.Hence, by ranking the songs with respect to the affinity value we can select some songs which are above a threshold affinity and project a recommendation for the users with the same kind of musical taste.
For example, the below figure shows a recommendation network obtained from the affinity matrix for the users who have listened the song "Where is my mind?" by "The Pixies". We have here selected top 5 associated songs for each tracks.

Thus, starting from a song one can navigate to other similar type of songs through this network. This network can be used in recommending mix playlists to users. This kind of networks is also suitable for implementation in a web-based context, where users click a certain song and then links to other recommended songs are shown.
Now we focus on the evolution of popularity of songs. The most repeated songs are the bridges between the different musical tastes. The authors have selected the top 5 tracks of 2005 according to the degree in the network. The below picture shows the evolution of those tracks with respect to the total number of playlists in the network since 1997. (This can also be an indicator of time)

It is observed that four of them (except the green one) were present in the network since 1997.They followed a rapid growth of appearance (inset picture) until a certain value, then remained constant.This indicates that the popular songs have a transient growth to the final value of their rate of appearance.Though it is intuitive to expect that after a certain time the rate of appearance of top hit charts decays, some "Classics" may keep their constant rate of appearance despite of their aging.The behavior of the last track (green line in the picture) is different from the other four.It appears at later times and its rate of appearance is still not saturated.It may overcome the others in later time and reach the top of the list.However, these five tracks are the top tracks of 2005, all of them were not the previous lists.
Other related works
Many researcher have tried to model musical entities as networks for better insights.Pedro Cano, Oscar Celma and Marcus Koppenberger [2] worked on the topology of several music recommendation systems.They studied on the music data collected from MSN-Entertainment, Amazon, AllMusicGuide (AMG) and Launch-Yahoo! portals.Their study shows very similar network characteristics.Chi K. Tse, Xiaofan Liu and Michael Small [3] studied the complex network of musical notes of the compositions of Mozart, Bach and several other musicians.According to their notions, the nodes are the individual musical notes and a link between two nodes denotes that the two musical notes are neighbors in the score.They studied the network parameters which again followed similar "small-world" properties.
 | ||
| Network from Bach's sonatas |
T. Teitelbaum, P. Balenzuela, P. Cano, and Javier M. Buldú [4] studied the community structure in music network on the data collected from All-Music database.They studied two types of artist networks - The similarity network, artists are linked if their music are somewhat similar and the collaboration network, where artists are linked if they have performed together.
 |
| Network characteristics of two types of artist network |
For the community detection, they used Girvan-Newman algorithm and hierarchical clustering algorithm.
 |
| Top five community in the similarity network |
Conclusion
This article is based on the descriptive study on the network of music.We have seen that the networks share properties same as the other real world network systems.We have seen the behavior of top hit songs and their association over time.Further study can be done on the directionality of the playlists.If we consider a playlist as a sequence of elements with
a compositional intent, the order in which songs appear encodes important information for the development of music recommendation systems.
a compositional intent, the order in which songs appear encodes important information for the development of music recommendation systems.
References
1. "The complex network of musical tastes", Javier M Buldu, P Cano, M Koppenberger, Juan A Almendral and S Boccaletti,Published 28 June 2007, IOP Publishing and Deutsche Physikalische Gesellschaft, ,
,
Pedro Cano, Oscar Celma and Marcus Koppenberger
Analyzing and Composing Music with Complex Networks: Finding Structures in Bach’s, Chopin’s and Mozart’sNOLTA'08, Budapest, Hungary, September 7-10, 2008
4. "Community structures and role detection in music networks", T. Teitelbaum, P. Balenzuela, P. Cano, and Javier M. Buld, Chaos 18, 043105 (2008)
No comments:
Post a Comment